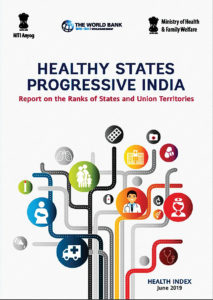
Delhi is not a model city when it comes to health indices, according to a report by NITI Aayog comparing all the states and UTs
While the Delhi government and the Centre squabble over who gives better health cover and facilities to the residents, a report shows declining Health Index in the country’s Capital.
The report by NITI Aayog ‘Healthy states in progressive India’ shows that among the Union Territories in the country Delhi was one of three – including Lakshadweep, Andaman and
Nicobar Islands – which showed a decline in their overall Health Index scores. This is despite the fact that Delhi has a relatively high level of economic development. While earlier Delhi’s ranking amongst UTs was third, it dropped to No. 5.
What should be worrying is that the number of tuberculosis (TB) cases have increased in Delhi, from 348 cases per 1 lakh population in 2016, to 360 in 2017. The number may not look significant, but an increase instead of a decline should be a red flag for the government’s health bodies, especially as the Centre has announced that it will work to make the country TB-free by 2025.
The report points out that the total case notification rate of TB in India has the highest disease burden of TB globally. Total case notification rate is one of the critical indicators on TB management and control in a country. It reflects the progress in detecting and reporting newly diagnosed TB cases or ones which have relapsed.
But it’s not just Delhi, significant increases were noted in several States and UTs including Chandigarh, Odisha, Lakshadweep, Gujarat and Karnataka.
Chandigarh’s increase is a massive number from 305 in 2016 (base year) to 523 in 2017 (reference year).
Delhi also failed to show a successful rate of treatment of new tuberculosis cases, with the success rate in 2015 being 86.7% which then fell a couple of notches to 84.8% in 2016. The Capital city’s UT neighbour, Chandigarh did marginally better at 85.6% success rate in 2015 which went up to 86.8% the next year.
Doctor Arvind Kumar Chairman of Thoracic and Robotic Surgery at Ganga Ram Hospital says the data suggesting an increase could be down to two factors.
One, TB is now a notifiable disease for which penalisation would occur if every case has not been reported. Thus, there would be an increase of reporting.
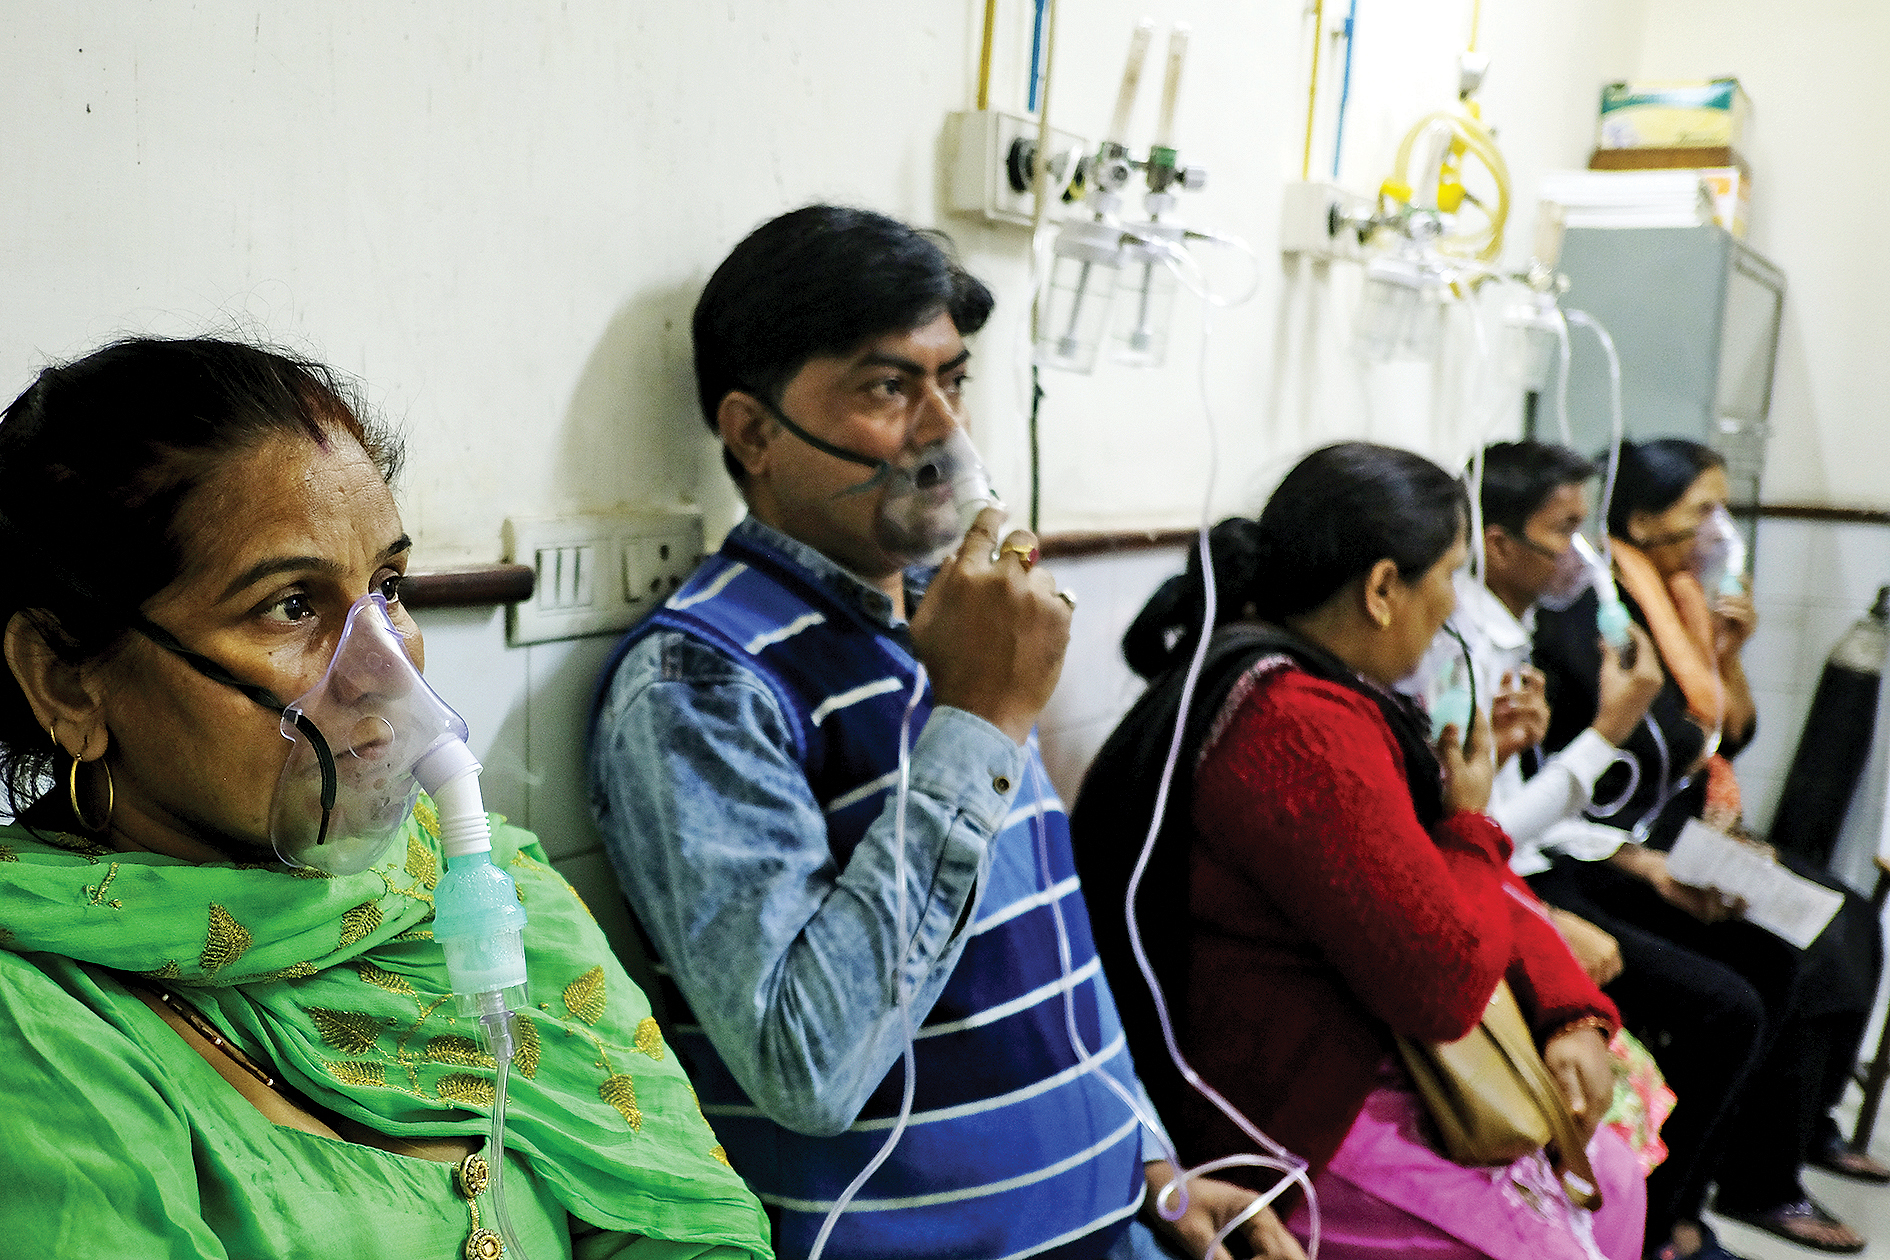
Secondly, Kumar mentions that with all respiratory illnesses increasing, incidents of increase in TB cases would run parallel to it. “We are all seeing diseases attributed to pollution increasing. But when an esteemed minister replies in the Lok Sabha that there is no data to suggest that high mortality is directly linked to air pollution then how can we find a solution”, Kumar says, referring to Environment Minister Prakash Javadekar who had rejected the reports on life expectancy being reduced in India and children dying due to air pollution and rising ozone levels.
Kumar says this is a problem because “pollutions is a slow killer. You need to do a huge study to determine this is taking place. This study may take 20 years and by then millions would die because of it”.
Key influencers
People in key administrative positions in healthcare would have a critical effect on what the residents of that region receive. The report points out that key jobs occupied by officers “is critical to ensure the effectiveness and sustainability of public health programs”. It chalks out the average occupancy of an officer for three key posts at State level in the last three years.
Based on the data from States in 2015-18, the average occupancy of Principal Secretary, Mission Director (NHM), and Director (Health Services) or equivalent positions in a period of three years was highest in West Bengal (28 months), and lowest in Nagaland (5.8 months).
Out of the 36 States and UTs, 21 had an average occupancy of twelve months or more per officer. Average occupancy of an officer in Chandigarh saw a good increase from 12 months in base year 2013-16 to 18 months in 2015-18. Delhi yet again disappointed with its numbers which got down from 9.6 months in between 2013-16 to seven months in the years between 2015-2018.
Then we come to the average occupancy of a District Chief Medical Officer (CMO) or equivalent post (heading District Health Services full-time) in last three years.
The seven States/UTs that had less than 12 months of average CMO occupancy include Uttar Pradesh, Uttarakhand, and Chandigarh. In this at least Delhi showed a positive sign – with numbers going up from 16.7 in base year 2013-16 to 25.0 in reference year (2015-18) – unlike Chandigarh with a good increase of occupancy.
Why this is significant is because with shorter occupancy, the seeing through of key public health programs would be hindered.
But while Delhi showed one positive break, it again slumped when the report looked at number of vacancies to fill up positions of staff nurses at Primary Health Centres (PHCs) and Community Health Centres (CHCs).
It called the “lack of manpower in public health facilities” as one of the main reasons of healthcare underutilidation. Delhi had more than 40% vacancy while Chandigarh had zero. The capital city’s increase is from the earlier 40.8% in 2015-16 to 46.9% in 2017-18.
Maternal health
First Referral Units (FRU) are district or sub-divisional hospitals which give facilities for reproductive and child health program. The report states that many have achieved the target of functional FRUs but Delhi is one of those that have not been able to achieve the required number.
While states like J&K and Telangana showed a significant increase from 196 and 80 centres in base years 2015-16 respectively, the reference years between 2017-18 went up to 220 and 114.3 respectively.
Even Chandigarh saw an increase from 150 centres in 2015-16 to 250 between 2017-18. But no surprises here, Delhi’s FRU has decreased from 100 in 2015-16 to 82.4 in 2017-18.
Furthermore, Cardiac Care Units (CCUs) in districts, which are an “important indicator of the ability of the health system to provide life-saving and critical procedures and interventions”, the Capital city showed a decline. While the earlier number was 90.9 per district in 2015-16, it went down to 72.7 in 2017-18. Here Chandigarh went from a zero to 200 CCUs per district.