On five important indices for India and the world, Delhi puts up a poor show. But it scores on two fronts — investment potential and per capital income
What makes Delhi what it is? Apart from the food, the parks, the wide roads, the Capital city has time and again got itself into embarrassing situations, where one would really question how things can be so bad in the Capital.
Patriot scrutinises the position of the Capital city in the country and the world, showcasing the good, the bad and the ugly.
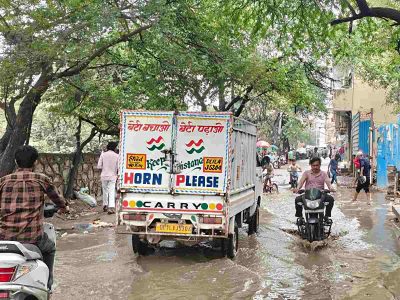
Traffic flow: 4th worst globally
Remember the last time you were stuck in a bumper-to-bumper jam at the Ashram crossing? Being one of the busiest intersections in the city, the Ashram crossing is a nightmare for many office goers in the peak hours in morning and evening. With over three lakh vehicles crossing the intersection, the situation affects the South Delhi-bound traffic from East Delhi and Noida. The number is not restricted to Ashram intersection but to others also, like ITO.
With over a crore vehicles, it’s no surprise that the Capital city sees the worst traffic flow. A report by technology specialist TomTom (also a provider of maps to Apple and Uber), ranked Delhi at fourth position in its ranking of cities with worst traffic flow.
Detailing the traffic situation in 403 cities in 56 countries, the report states that city goers in Delhi spend an average of 58% extra travel time stuck in traffic.
Vehicular pollution: Worst among 14
We would be wrong to assume that it’s only PM 10, 2.5 and 1 which is harmful for our health. Experts and studies have found that spike in benzene levels have not been acknowledged as much as they should be. Benzene is a toxic air pollutant and potent carcinogen.
The Capital city was ranked worst among 14 cities in the matter of vehicular emissions in a survey. Be it overall toxic emissions, heat-trapping emission and energy consumption, Delhi ranked worst in the study conducted by Centre for Science and Environment (CSE). Studies from IIT-Kanpur, TERI and ARAI found that vehicular emissions contribute around 9-20% of the PM10 and 2.5 load in Delhi.
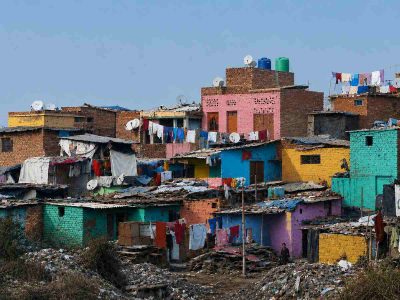
Liveability: 112th out of 140
While more and more people are migrating to the Capital city, for better livelihood options, reports on the quality of living, suggest they are not in for a good time. Although the per capita income of the Capital city is almost three times of the national average, a report by Economist Intelligence Unit (EIU), ranked Delhi at 112 on its list.
Taking into account an individual’s lifestyle in 140 cities worldwide, the liveability index assesses which cities provide the best living conditions. Categories such as stability, health care, culture and environment, education and infrastructure, included 30 qualitative and quantitative criteria.
Another survey by the union Ministry of Housing and Urban Affairs, ranked Delhi at 65 among 111 cities. The Ease of Living Index rankings are based on 79 indicators. These indicators are then grouped under four pillars — institutional, social, economic, and physical. While physical services are given more weightage (45%), it includes housing, water supply, sanitation.
Delhi not only performed poorly in this index, but also came 111th in the health ranking.
Waste: No.1 generator
Unlike other metropolitan cities like Chennai, Mumbai and Kolkata, the Capital city tops the charts with its generation of plastic waste. With 689 tonnes of plastic waste, the city beats down the other major cities, which fall in the bracket of 400-430 tonnes per day.
A CSE report also revealed that out of the total waste generated in Delhi, only 13% of it is best suited to be incinerated in the waste-to-energy plants. The rest, it says, can only be recycled or treated biologically.
To further show the reality of garbage management in the city, Chintan, an environment group and German NGO Giz had conducted a survey of 3,000 residents living in various neighbourhoods across east, north, south and New Delhi.
It revealed that 78% of the people living in the Capital dump garbage on the roadside.
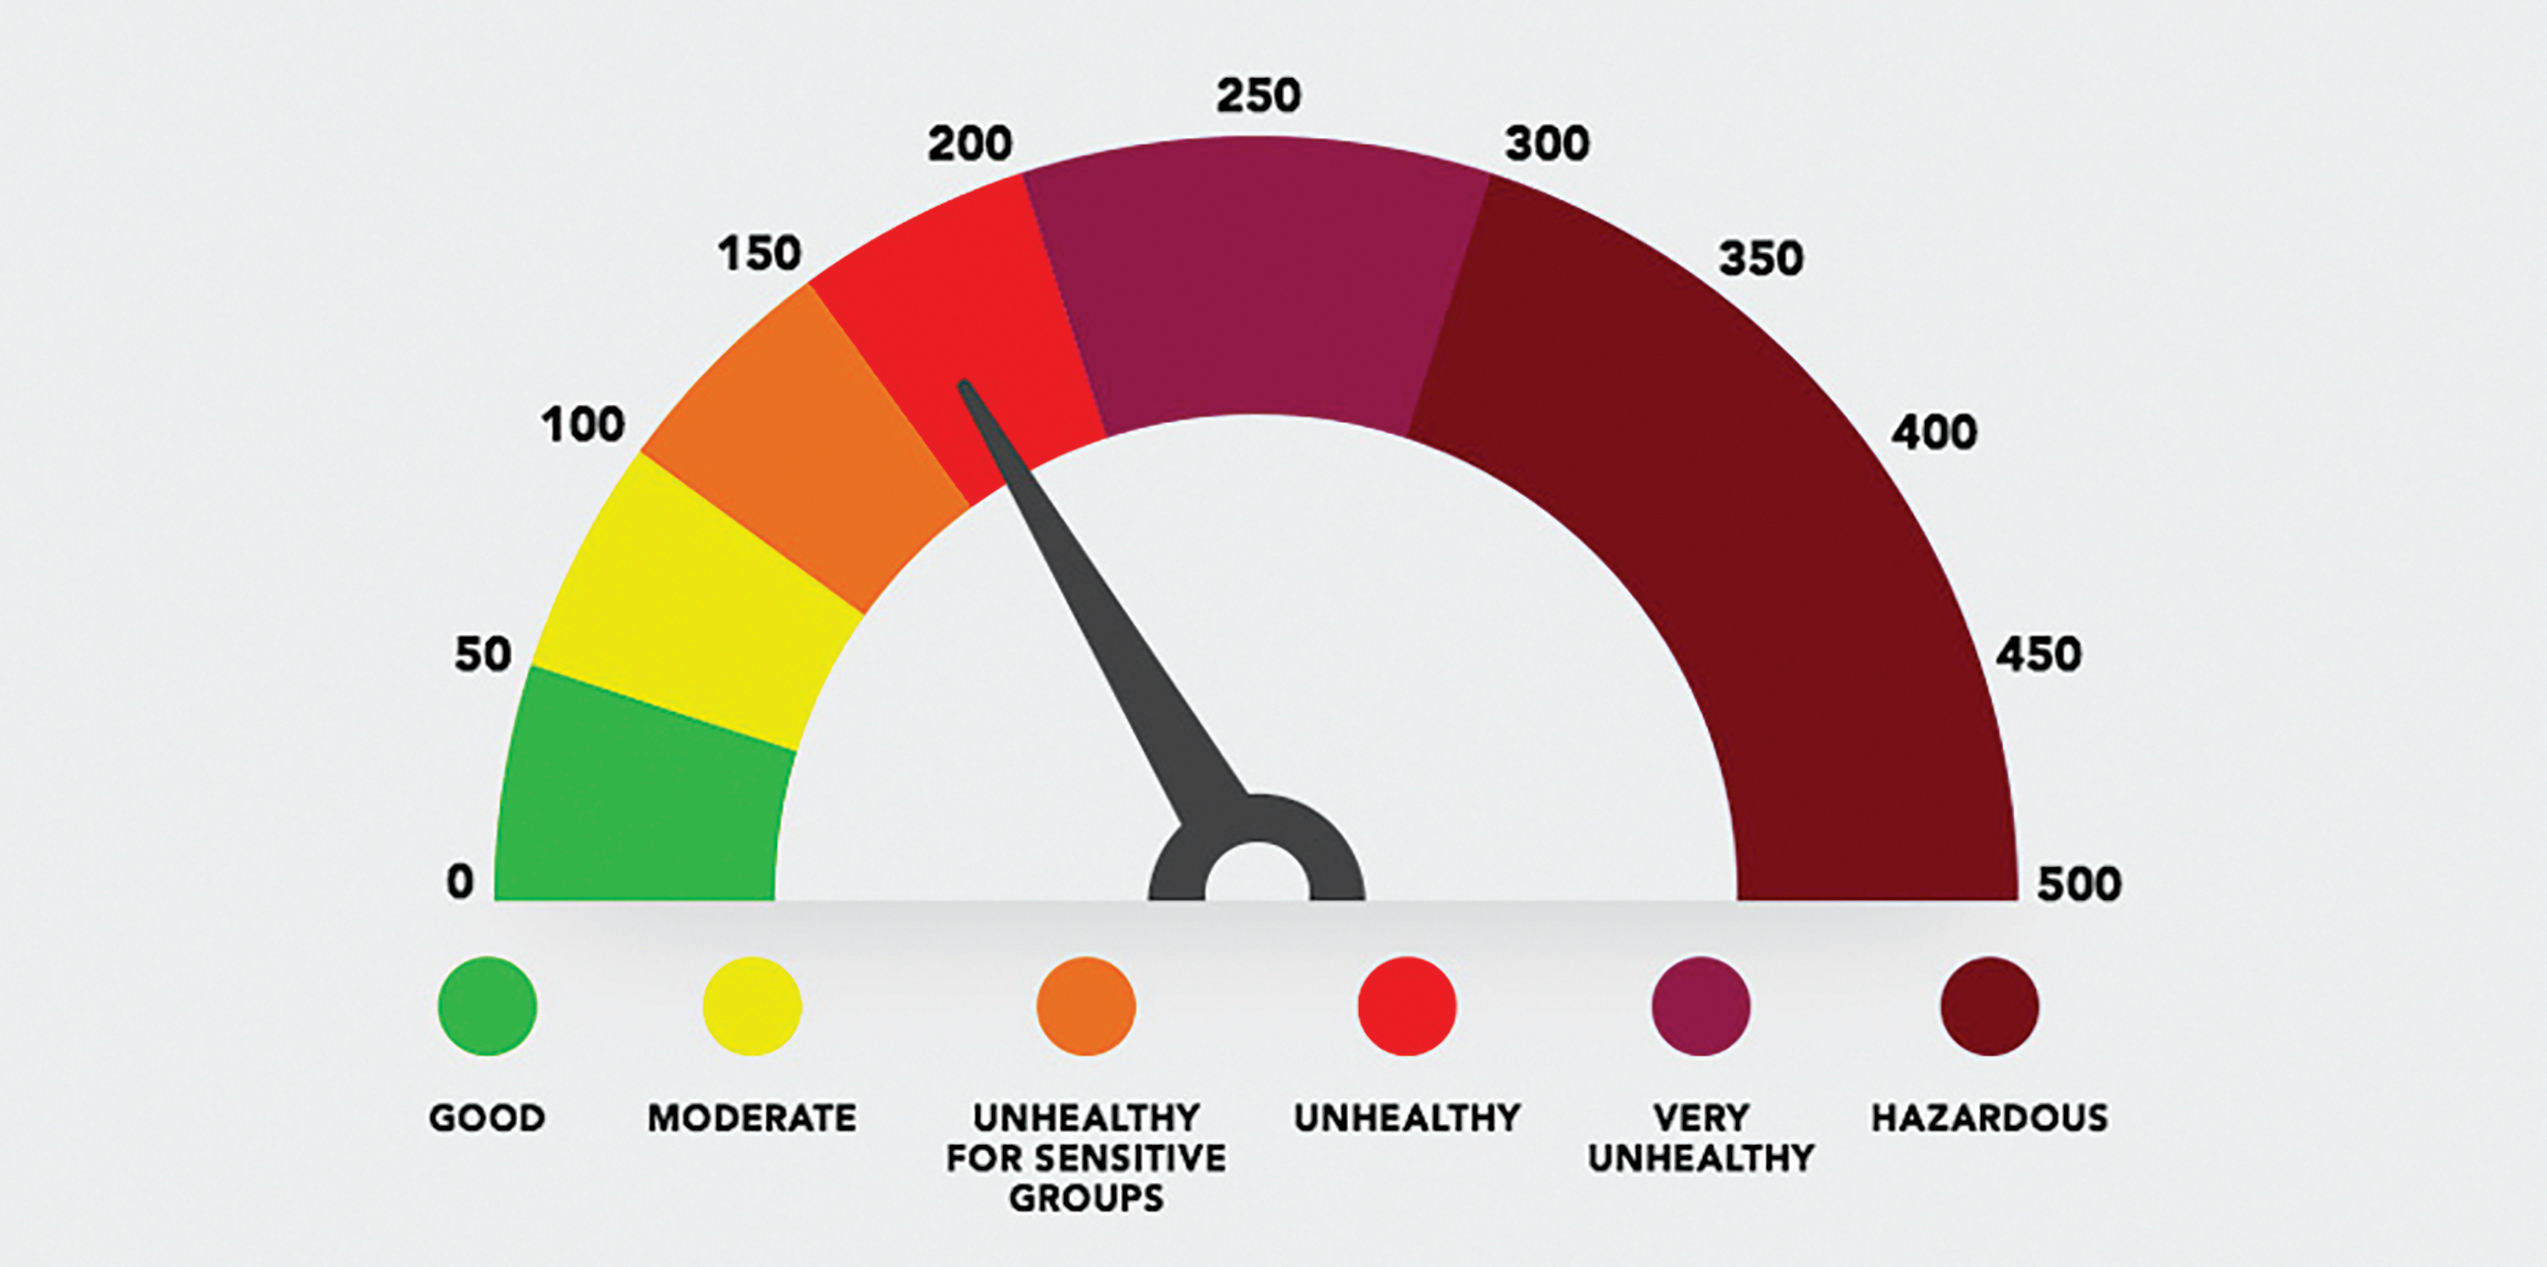
Air pollution: No.1 among Capitals
Although Delhi is one of country’s greenest cities with 7% of its geographical area dominated by trees, it also holds the title of world’s most polluted national capital.
From holding “severe” to reaching “emergency” status for its air quality, Delhi witnessed an AQI of 654 in some its areas. Anything above 100 is considered unhealthy.
In a report published by Greenpeace, the organisation looked at readings from 3,000 cities around the world. It found that 64% exceed the World Health Organisation’s yearly exposure guideline for PM2.5. This small particle is 40th the width of a human hair.
The report was based on 2018 air quality data from public monitoring sources, government monitoring networks, while also receiving data from outdoor IQAir AirVisual monitors.
Last year, every day, the air quality index was stuck on an average of 400-450, while visibility was only 200 metres. As per a Lancet Planetary Health study, 1.24 million died due to country’s toxic air.
Investment potential: No. 1 in India
Breaking the monotony, the city topped one index, which is an essential part of any city’s growth. The index released by National Council of Applied Economic Research (NCAER), puts Delhi to the top position for his State Investment Potential Index (N-SIPI).
Making Delhi as the most investor-friendly state, the survey was extensively executed, covering 1,049 industrial units across 20 major states and Delhi.
The index was formulated on the basis of six pillars that are put into categories like factor-driven, efficiency-driven, growth-driven and perceptions driven.
The aim of the index is to help policymakers, existing businesses, potential domestic and oversea investors.
Per capita income: No. 2 in India
This year brought good news. According to the Economic Survey that was tabled in the Assembly, Delhi’s per capita income was pegged at Rs 3.5 lakhs, three times the national average. The Capital city also saw an increase in its gross state domestic product — Rs. 7.79 lakh crore, an increase of 12.98% throughout 2017-18.
Not only this, the Economic Survey also showed an increase in the supply of electricity in the Capital city — from 37,484 million units in 2014-15 to 38,510 million units in 2017-18.
The number of power consumers in Delhi was 57.55 lakh in 2017-18. The number of power consumers in Delhi
has increased by 71.92% during the past decade, the report
says.